
Project Overview
This project evaluates how schedule structure — location, travel, and rest — influences game difficulty, and applies those league-wide patterns to UCLA Women’s Basketball’s 2026 schedule.
Rather than modeling team talent or player performance, the goal is to isolate contextual difficulty:
How hard is a game based on where it’s played, how far the team travels, and how the schedule is sequenced?
To do this, I:
- trained a league-level model on Big Ten Women’s Basketball 2025 results, and
- applied that model to UCLA’s 2026 schedule to identify difficult stretches and travel-heavy periods.
This mirrors how front offices often separate team quality from schedule effects when evaluating performance.
Motivation
Game outcomes are often evaluated without accounting for contextual factors such as travel burden, short rest, or extended road trips. For teams competing across geographically dispersed conferences, these factors can materially affect performance but are difficult to quantify.
The goal of this project is not to predict wins or losses, but to identify portions of the schedule where contextual disadvantage is elevated, allowing performance to be interpreted through a more accurate lens.
Data & Methodology (high level)
- Training data: Big Ten WBB 2025 game results
- Target application: UCLA WBB 2026 schedule
- Key inputs:
- Game location (home / away / neutral)
- Travel distance (based on team base locations)
- Days of rest between games
Neutral-site games are modeled with travel distance but without home-court advantage, reflecting that teams still travel while no side benefits from familiarity.
The model is intentionally simple and interpretable, focusing on context, not prediction accuracy.
League Insight: Travel Context Matters
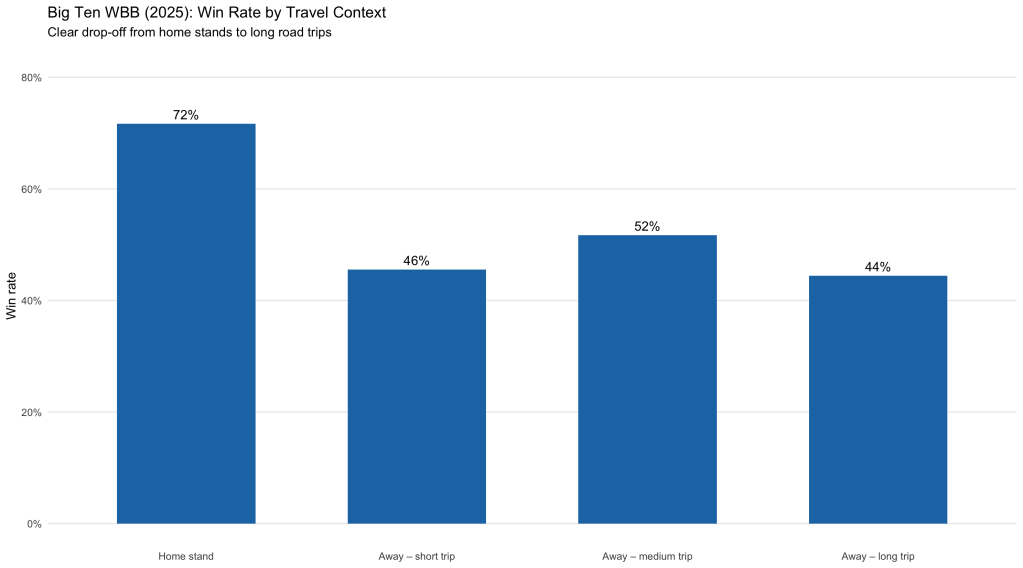
The first visualization looks at league-wide performance by travel context.
Key takeaway:
Teams perform best during home stands, worse on the road, and worst on long road trips.
This aligns with intuition:
- home games benefit from familiarity and routine
- away games introduce disruption
- longer trips compound that disruption
While travel distance alone is not the dominant driver of outcomes, location clearly matters, and longer travel is associated with lower win rates within away games.
This league-level context is what informs the UCLA application.
UCLA Application: Schedule Difficulty Profile
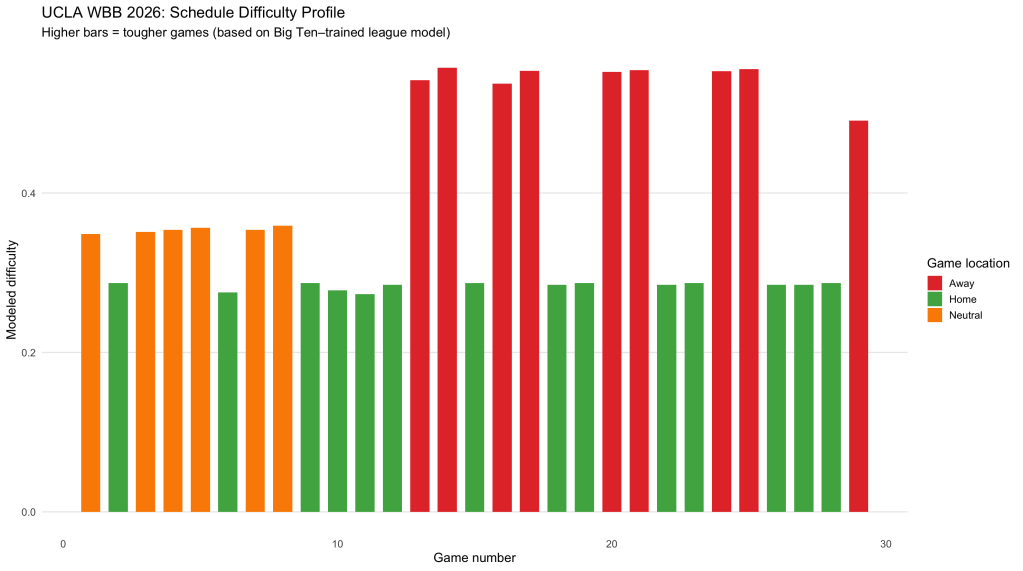
Using the league-trained model, each UCLA game is assigned a modeled difficulty score based on location, travel, and rest — independent of opponent talent.
The resulting difficulty scores highlight clusters of elevated contextual stress, typically driven by:
- Multi-game road trips with limited rest
- Long-distance travel between consecutive games
- Neutral-site games embedded within travel-heavy stretches
Rather than treating all road games equally, the model distinguishes between routine travel and structurally taxing stretches.
In the visualization below, spikes correspond to games or stretches where modeled difficulty is meaningfully above the league baseline, indicating increased contextual burden.
UCLA Travel Load: When the Miles Add Up
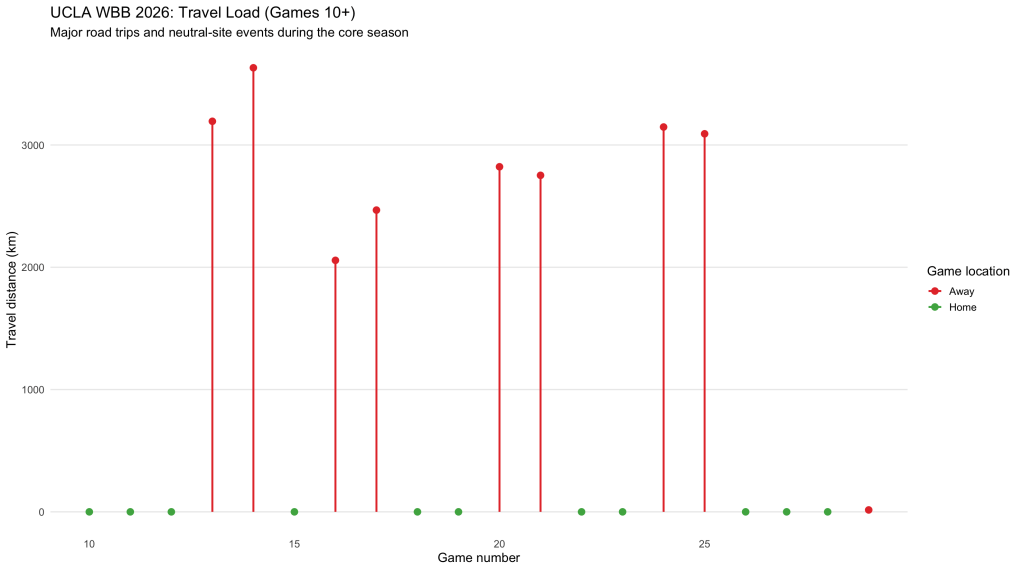
The travel timeline focuses on Games 10 onward, removing early-season tournaments and tune-up noise. Note: Last away game is USC (In LA)
This view highlights:
- major road trips
- neutral-site travel events
- periods where travel demand spikes
Paired with the difficulty profile, it becomes clear why certain stretches are harder — not because of opponent strength alone, but because of cumulative travel and location effects.
This type of visualization is especially useful for planning recovery, practice intensity, and travel logistics.
What This Project Is — and Is Not
This project does:
- isolate schedule-driven difficulty
- provide league context for interpreting outcomes
- highlight challenging stretches of a season
This project does not:
- evaluate roster strength or coaching decisions
- predict game outcomes with precision
- claim fatigue is a dominant causal factor
The results show that location effects dominate, with travel and rest contributing smaller, noisier signals — a realistic outcome in single-season college data.
Limitations
- The model reflects league-average historical patterns, not UCLA-specific responses to travel.
- Defensive schemes, roster depth, and opponent matchups are not included.
- Difficulty scores are relative, not absolute measures of hardship.
These constraints are intentional to preserve interpretability and avoid overfitting.
Why This Matters
Schedule context is often overlooked when evaluating performance.
By separating who you play from where and when you play, this framework helps answer questions like:
- Why did performance dip during this stretch?
- Was a road-heavy sequence a contributing factor?
- How does this team’s schedule compare structurally to the league?
This type of analysis supports more informed evaluation, not overconfident conclusions.
Git: https://github.com/ArmaanSharmas/ucla-wbb-schedule-difficulty
Thanks for reading!
By, Armaan Sharma
